“Envisioning Networks” is a visualization gallery designed to serve as a data visualization library for envisioning telecommunication data for network operations, management and monitoring applications in Nokia Networks Business. The application is created using d3 (Data-Driven Document) as it provides for the creation of interactive and animated visualizations. The gallery will serve as a starting point for User Experience Designers, Web developers, Product managers and Sales managers while designing, developing as well as for marketing solutions.
Interface and interaction modality
The project is a web-based application showcasing the different types of visualization that can be incorporated into telecom domain and build using d3. The home page provides the details of the project along with the video. Then the visualisation page contains all the visualizations in a grid format and the user can browse and explore the usage of each of the visualizations in detail. It provides the basic web interactions like click, mouse over, mouse leave, drag etc. Finally the about page basically giving a background to the project. User Experience
The application has a simple user interface following the Nokia standard look and feel used across web and desktop applications in Nokia networks business. As the intended audience is User Experience Designers, Web developers, Product managers and Sales managers the interface has been kept simple and sophisticated. Research and development context
The project was developed as a proof of concept of how d3 as a framework can be used for creating big data visualizations especially in telecommunication domain where the volume of data is huge. Also the ability of d3 to support animations and interactions is pivotal given the numerous dimensions of the data analysed as well as the need to auto reload and refresh the data in intervals ranging from one minute to one hour. D3 supports creation of custom charts and through this project the main goal was to find representations that suit most of the use cases to create a uniform visual and interactive data visualization across multiple applications and a wide spectrum of users in the telecom domain. Technology
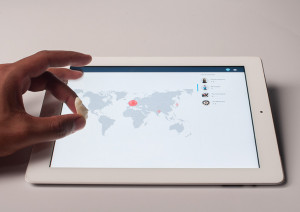
The gallery has been developed mainy using d3.js which creates visualisations as SVGs along with html5, css3, javascript, jquery. For map based visualization topojson and queue.js from d3 have been used. Also d3.tooltip has been used for tooltip creation.